By Scott Batchelor and Dan Zaratsian
It’s well documented that tweets can boost a company’s brand or cause public relations nightmares. The insights gained by everyday conversations on social media can also be invaluable. Not only can they help you help you validate campaign effectiveness, but they also provide a snapshot into what’s trending among your customers.
Brands that are successful on social media do more than just post content – they also listen and analyze. Crises can be quickly be averted, customers can be retained and loyalty can be solidified when action is taken based on information gathered from blogs, tweets and comments. And when that data is analyzed, companies gain a treasure trove of actionable insights.
Retailers will know which styles are gaining popularity in different geographies. Credit card companies can find out which perks are seen as most desirable among its customer base. Cable companies learn what customers think about its service, pricing and support operations. Auto makers see which models are popular in certain parts of the country.
So, how do you get started with understanding social media sentiment? There are three steps that marketers need to take when analyzing social media:
- Collect the data
- Analyze the data
- Visualize the data
To demonstrate the amount of information that can be gleaned from social media sentiment, we collected and analyzed tweets pertaining to the NCAA men’s basketball championship. Knowing that more than 11 percent of workers will participate in an office pool this year, we hypothesized that a flurry of tweets with Final Four predictions would provide data into which teams have the best chances to cut down the nets in Arlington, Texas. And help us win the office pool! The reality is that while it wasn’t the best way to predict the Final Four, it did show some fascinating trends.
Collect the data
The first step to analyzing social media is data collection. There are several methods that can be used to mine data, but it starts with a list of search terms, phrases and hashtags. For this exercise, we focused on phrases like “finalfour,” “final4,” and “Final Four predictions.” The raw data – more than 68,000 tweets – was full of abbreviations (such as “UNC” instead of the “University of North Carolina”) and misspellings. But those can be intelligently filtered using text analytics as part of the next stage.
Analyze the data
Now that you have the data, you need to make sense of it and discover what it can tell you about your business—or in this case, the Final Four. That’s where text analysis comes in. Passing the dataset through text analytics technology allows you to clean up the jargon and understand what is really being said. Text analytics also helps to clarify ambiguous terms – in this case making sure teams like “Michigan” and “Michigan State” are viewed as separate entities. Our analysis of tweets over four days after Selection Sunday revealed that some teams were being mentioned more than others for the coveted spots in the Final Four:
- Florida……………….. 30.19%
- Louisville…………….. 24.86%
- Arizona………………. 20.78%
- Michigan State……… 17.05%
- Duke………………….. 14.32%
- Wichita State……….. 11.96%
- Michigan…………….. 9.96%
- Iowa State…………… 8.72%
- Wisconsin……………. 8.28%
10.Creighton……………. 8.25%
As the tournament progressed, these numbers changed dramatically as some teams advanced (Dayton) and others were upset (Duke). More people started to talk about Cinderella teams like Stephen F. Austin and Mercer while top-seeded Wichita State fell off the map after their loss.
Visualize the data
Seeing trends in the data is the final step. This visualization of the data is what provides a clear picture into what the masses are thinking, saying and doing. Whether the output is a scatter graph, a pie chart or a heat map, it’s easy to understand what the data is telling you. For example, this type of visual data can help you easily see where your campaigns are resonating, allowing you to formulate your next move and increase your chances for success.
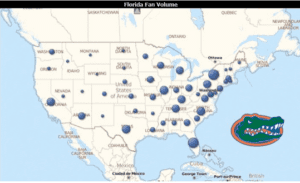
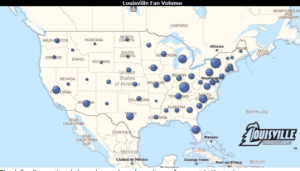
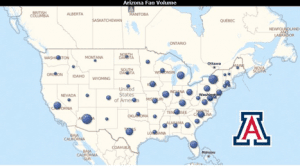
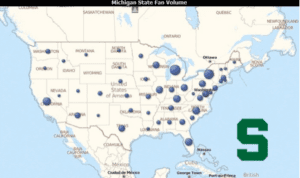
For our March Madness experiment, we took the top four trending teams and plotted where the picks are originating. This shows which teams enjoy more national support than others.


Does this mean that the Gators, Cardinals, Wildcats and Spartans are guaranteed spots in the Final Four? Of course not, since three of those four teams will be watching the games this weekend at home instead of playing in them. But it does show where fans are talking about these teams across the country.
How valuable is it for you to know where your products and services are being adopted? Or how marketing campaigns are being received in different parts of the country? That’s the type of information text analytics can deliver.
Modern marketers that understand the power of social media – not just by developing a brand, but by listening and analyzing what’s being said – will gain actionable insights that will propel their marketing plans forward. And that’s more valuable than any game-winning buzzer beater from beyond the arc.
Scott Batchelor is a marketing manager at SAS and Dan Zaratsian is a text analytics technical consultant at SAS.


