In this series, we’ve been examining the 5 keys to designing and deploying an effective marketing dashboard. They are:
- Building cross-functional alignment on the role of marketing in the organization;
- Mapping the knowledge base to identify possible critical metrics;
- Providing a financial (versus purely strategic) framework for bridging short- and long-term results from marketing investments;
- Building a comprehensive brand scorecard; and,
- Designing a highly engaging user interface.
The marketing dashboard is intended to track both the inputs — the marketing activities being undertaken — and the outputs — the financial results generated. If you’ve followed closely so far, you can see that leaves the possibility of a gap in the middle – the asset that’s being created in the form of the “potential value” that hasn’t yet materialized in a way it can be measured on the P&L. Many refer to this as the “long term” value of marketing investment, although in truth it may not take more than a few months to materialize.
Measuring the long-term value of marketing in creating customer preference and loyalty for your brand(s) is critically important in determining the return from the investment. Depending upon your industry or category, 50%, 60%, 70%, or more of your marketing expenditures in any given quarter may be in support of programs and initiatives that cannot be shown to have short-term effects on incremental profits, but can be shown to improve the health of the brand in the marketplace. But if this “brand health” isn’t something we can easily translate into forecast profits this year, we need a mechanism to treat it as an asset — something that generates positive returns over a longer period of time.
This is where a brand scorecard comes in. The brand scorecard tracks the health of the brand in the minds of customers and prospects. Whereas the marketing dashboard tends to look at things more from the company’s point of view — “What investments are made in programs and initiatives and what I should expect in return in terms of customer behavior?” — the brand scorecard asks, “What do our major constituencies of interest think, feel, and believe about our brand and how do those “equities” translate into future economic value?”

The Problem with Brand Scorecards Today
If you ask 100 companies to show you their brand scorecard (and we have), 20 will look at you quizzically, another 20 will show you elaborate consumer surveys of brand attribute ratings, and the remaining 60 will pull out a research summary of the latest scores on the classic “hierarchy of effects” waterfall:
• 74% of consumers are aware of the brand on an unaided basis
• 61% indicate an overall favorable impression of the brand
• 47% indicate a willingness to try the product
… and so on.
The problem with this typical waterfall is that it never actually connects awareness or preferences to value creation, and as such is seen by the CFO and the rest of the finance department as “marketing mumbo jumbo” used to justify spending money.
Awareness is a not an achievement unto itself. Each of us is personally aware of a great many companies that we know nothing about. We don’t know what they make or do, and even if we know, we have no clue as to why we might want to buy their product or service. There’s no salience to that awareness that places it into a proper context for us.
Salience itself may have multiple levels. I may know IBM makes computers, but I may not know they make the kind of Web servers I need for my company.
Preference also has many potential dimensions and degrees. I may prefer to drive a Jaguar, but have no realistic hope of ever being able to afford one. I might thereby “prefer” the Hyundai to the Kia, but do I really “prefer” the Hyundai?
The aforementioned examples indicate how stated brand preference is of little value absent a very specific context – i.e. those that are physically available to me and within my affordability zone at the time when I am most likely to translate my attitudes into behavior and buy.
There’s little doubt that salient awareness, contextual preference, and qualified purchase intentions can be valuable indicators of the potential economic value of the brand. But until they are unlocked and flowing freely from the minds and hearts of the customers to their wallets and into our company treasury, we must find a way to measure them for what they are: Assets. Good intentions. Accumulated goodwill toward the brand that has not yet translated into a financial outcome.
The role of the brand scorecard within the marketing dashboard is to reflect the evolution of these brand assets and continually gauge the potential value of the demand they represent. For this unique reason, we recommend setting up the brand scorecard as a separate-but-linked portion of the overall marketing dashboard. Doing so helps to highlight both the input/output importance of the dashboard and the asset-nurturing insights of the brand scorecard.
Constructing the Brand Value Chain
To identify the leading indicators of economic behavior, we need to understand two critical things about how our business operates:
- How do brands create economic value in our business?; and
- What are the “drivers” that would predict the imminent realization of that value?
The chart in Figure 8 below lays out the information needs in the form of a Brand Value Chain. In the chain, marketing activity creates some type of salient awareness, which in turn leads to the formation of relevant and (hopefully) differentiated attitudes or beliefs, which subsequently increase the likelihood of purchasing, purchasing more, paying more for the product, or maybe just continuing to purchase in the face of massive competitive pressure.
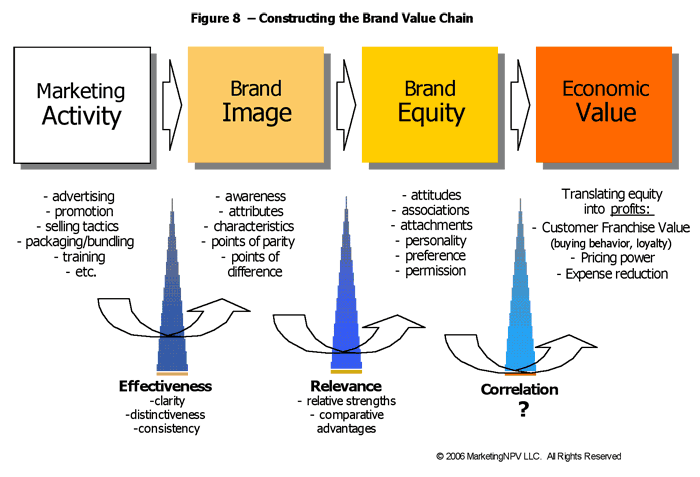
Our Brand Scorecard should be tracking how effective our activities are at creating the right imagery; how that imagery is translating into the right set of beliefs, associations, and permissions; and how those equities are creating tangible value for shareholders. We must clearly define, test, and establish these links to have any hope of defending “branding” investments. It’s neither cheap nor easy. But without reasonable proof of the benefit, why would any CEO continue to invest?
Now before all the researchers and academics right me letters reminding me of the limitations and dangers inherent in this oversimplified linear model, let me just state that YOUR version of this model might look quite different. Your circumstances might not require imagery to form before attitudes, or attitudes before behaviors. In fact, different segments of your customer/prospect base might actually have different paths to purchase behavior. YOUR diagram may not resemble a chain at all. Nevertheless, we use this example as a means of beginning to think through the types of information needed for our Brand Scorecard.
Once we can identify how investments in branding create leading indicators of specific economic value to come, it’s much easier to explain the rationale for spending money now. It’s these “drivers” of value creation that become the key metrics to monitor in your Brand Scorecard. Without that, your branding recommendations are just a long series of extensions of your personal credibility. And that’s one chain that you never want to stretch too far.
Up next in our series, we’ll look at some keys to designing the right user interface to ensure your dashboard actually gets used and becomes the common source of insight that liberates the organization to focus on tomorrow’s opportunities and challenges instead of yesterday’s results.
Pat LaPointe is Managing Partner at MarketingNPV (insert link to www.marketingnpv.com) – a highly specialized consulting firm that builds marketing measurement frameworks, analytical processes, and marketing dashboards for Global 1000 companies across industries. He is also the author of Marketing by the Dashboard Light: How to Get More Insight, Foresight, and Accountability from Your Marketing Investments.
The Other Keys
Here are links to the other articles in this series:
Part 1: https://www.chiefmarketer.com/crm_loop/roi/marketing_dashboard/index.html
Part 2: https://www.chiefmarketer.com/crm_loop/roi/effective_marketing_dashboard/index.html
Part 3: https://www.chiefmarketer.com/crm_loop/dashboard-three-090706/index.html